There are many ways to manage and keep an eye on Azure spend using Cost Alerts for subscriptions, departmental budgets, etc. (And even more recently in Preview at the time of writing, Azure Cost allocation).
However, an additional tool in the Azure arsenal is to harness an Azure Dashboard. Using a dashboard can be a great way to provide Azure cost overview. For example, by infrastructure, departments, resource types, etc.
Being able to have an overview of spend across a personalised costing dashboard tailored to your needs is a great use case for an Azure Dashboard.
Azure resource tags are going to be key on helping organise, manage and track spend across Azure resources. It’s critical this is in order across the subscription to get the most out of granular filtering and cost tracking.
Customise Azure cost metrics
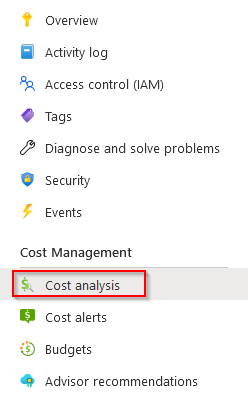
Firstly, you’ll need to understand what you want to track, and filter based on requirements. Head over to the Azure Subscription and under Cost Management select Cost analysis.
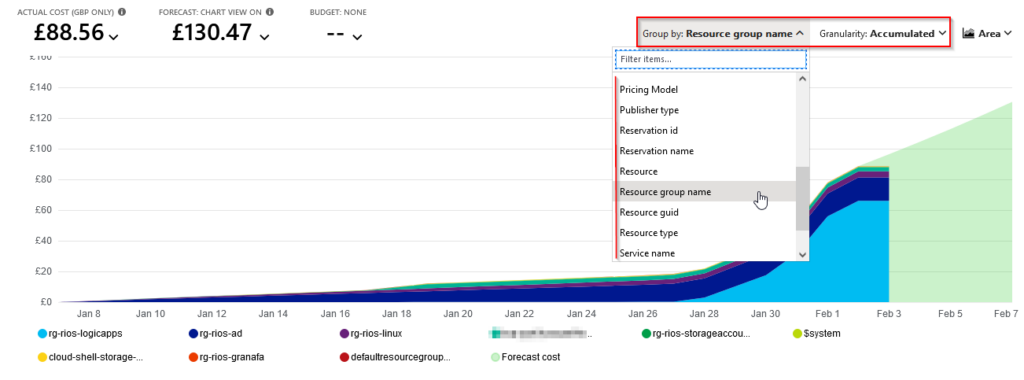
Next, lets filter the cost metrics to display on the dashboard. If only interested in specific resource groups, resources, or even just a particular solution or departmental tags then here is where it can be done.

Azure Dashboard creation & pinning analysis
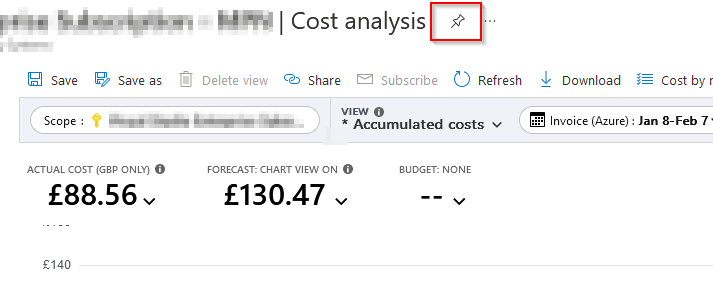
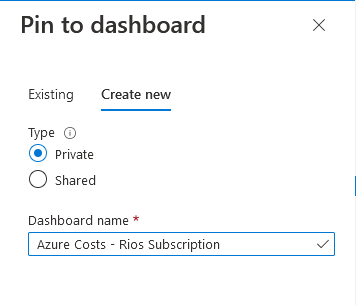
After personalising the analysis metric, we can pin this to a dashboard. This can be an existing, new, private or sharable dashboard.
Let’s head back to the cost analysis to pin more relevant spend metrics to add to the dashboard for overview.
Dashboard configuration & overview
In the dashboard, click edit and organise the tiles and size. Additionally, you can click the three dots and “Configure tile settings” to give each tile a name and subheading.
Furthermore, you can amend the refresh schedule for the dashboard to update the tiles on a schedule.
Lastly, there are options for the dashboard to be published and shared, even with role-based access controls.
Conclusion
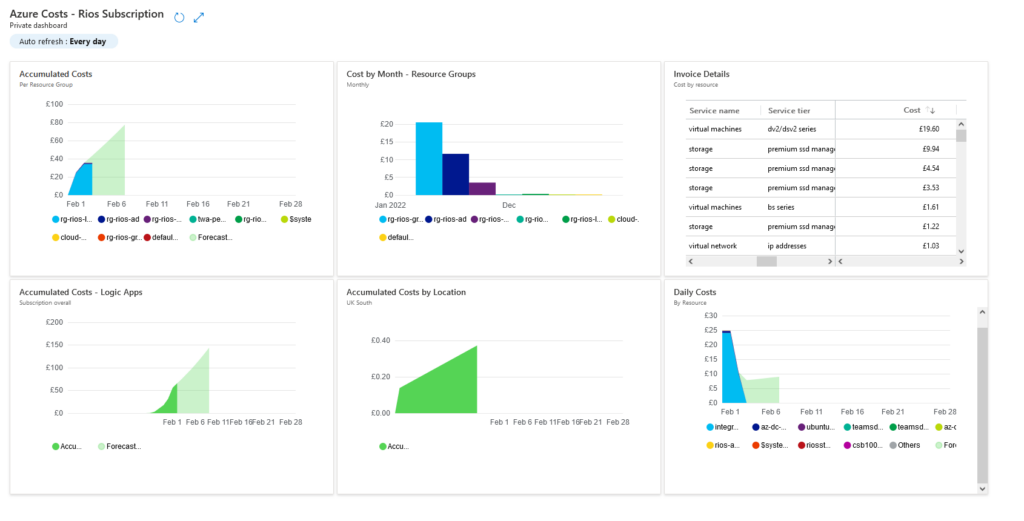
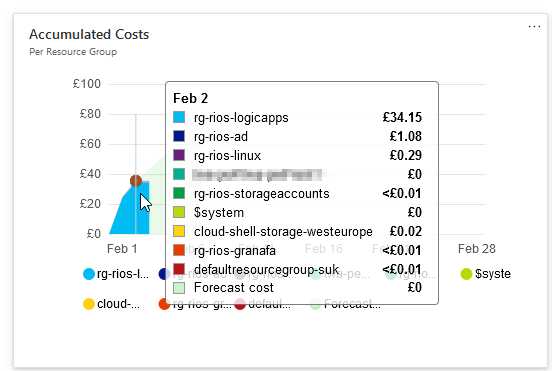
As seen above – you can create some awesome looking dashboards to help give some great insight and ability to track costs proactively. Quick to setup and share out to relevant stakeholders too.
This can be great to keep an eye on potential cost forecasts, on-going resource costs, but importantly, help identify some areas of high resource costs which can be an opportunity to review tier plans and scale back if necessary.
I’ve found dashboards helpful to also create for specific solutions or products to help give a quick overview from a cost monitoring point of view. It’s also something stakeholders and management teams can easily view, digest, and understand, save as a web favourite, or add into a Teams tab.